Newsletter #8
Enjoy Newsletter #8.
Let’s deadlock all the things
Michael J. Simons recounts a “rookie mistake” he made while migrating code from legacy HttpURLConnection to Java’s modern HttpClient. Because HttpClient does not directly expose an OutputStream for streaming data into a request body (for instance, when using Jackson to serialize a large JSON payload), he connected a PipedInputStream and a PipedOutputStream and ended up performing both the write and the read on the same thread—even though the JavaDoc explicitly warns that doing so can deadlock. Initial unit tests passed because the test payloads were tiny, but as soon as a payload exceeded the default 1,024-byte pipe buffer in production, the thread blocked forever; repeated enough times, it starves the entire thread pool.
What could have prevented the bug, the author reflects, was a little less overconfidence, a second pair of eyes in code review, and thorough boundary testing. AI assistants might help generate larger test payloads, he notes, but rarely catch subtle API misuses—and even IntelliJ didn’t flag a warning. The fix was to create the two streams independently, connect them outside both the reader and writer lambdas, run the write operation on a dedicated virtual thread, and close the output stream inside that thread. It’s a great reminder to read the JavaDoc carefully and understand the threading model of the APIs you use.
Engineers who won’t commit
Sean Goedecke argues that sitting on the fence in technical discussions is only acceptable when you are a junior engineer. Once you are the person in the room with the most context, skill, or influence, you have a responsibility to take a position—even when you are only 55–60% confident. Staying silent forces less-informed teammates to guess, creates a vacuum where the loudest, least-competent voice can steer the group into a bad idea, and ultimately punts hard technical decisions onto engineering managers. The author bluntly calls this refusal to commit cowardice, rooted in a fear of being wrong that he himself had to overcome earlier in his career.
Managers, he notes, are generally quite forgiving when you make a well-reasoned call that turns out to be wrong, as long as you aren’t wrong all the time. Refusing to give time estimates is the same failure mode: managers need a rough ballpark to plan around, and answering “it depends” just forces them to make up a number themselves. The one exception is genuinely toxic workplaces where engineers are punished for missed estimates—there, keeping your head down is understandable. He also adds that when brainstorming with peers who share your level of context, staying open-minded and exploratory is completely fine.
Patterns for building realtime features
Zak Knill surveys four common architectural patterns for building real-time features where a server pushes one user’s changes out to other connected clients. The poke/pull pattern is the easiest to bolt onto an existing system: the server sends a lightweight “poke” notification prompting clients to refetch the latest state via standard HTTP APIs, though this can trigger a thundering herd of simultaneous requests that must be mitigated with caching or client-side jitter. Push state sends the entire updated state payload directly, preventing client drift, but scales poorly as state objects grow and makes it hard for clients to tell exactly what changed. Push ops sends only the delta operation (such as flipping a todo item’s completed field), keeping payloads small, but requires a way to fetch initial state and demands that the server track each client’s current state version. Event sourcing broadcasts the domain event itself, requiring every client to reimplement the business logic needed to interpret and fold that event into local state.
At the transport layer, WebSockets, Server-Sent Events (SSE), and long polling all operate as 1-to-1 HTTP connections between a single client and a single server instance. Once you scale horizontally across multiple server replicas, the instance that processes a write is often not the instance holding open connections to the other clients that need the update. Rather than having every server replica poll the database, the author recommends using a Pub/Sub backbone to fan updates out across instances and manage connection infrastructure.
Optimizing the databases at Quora
The Quora engineering team shares how they optimized their database tier as the platform scaled to handle massive data volumes while keeping user-facing latency low. Their first strategy was partitioning data (sharding) by user_id to distribute load across multiple database servers. Alongside sharding, the team profiled common query patterns, added targeted indexes, and eliminated redundant queries. Quora also built a multi-layered caching architecture—spanning application-level caches for hot objects, database-level query caching, and a distributed Memcached tier—while separating read and write paths so each side could scale independently.
Beyond those core techniques, Quora invested heavily in comprehensive monitoring and alerting to track database health and catch anomalies early. Key takeaways include treating performance optimization as an ongoing discipline rather than a one-off project, building automation tooling for routine database administration, and constantly balancing raw performance gains against system simplicity.
Failure Mitigation for Microservices: An Intro to Aperture
Cong Ma and Matt Ranney from DoorDash examine common failure modes in microservice architectures: cascading failures rippling across service dependencies, retry storms where aggressive retries pile extra load onto an already degraded service, death spirals where failed nodes shift traffic onto surviving nodes until they collapse too, and metastable failures where a positive feedback loop keeps a system wedged even after the original trigger disappears. Traditional defenses like local load shedding, circuit breakers, and reactive autoscaling only see a single service’s local state, require brittle threshold tuning, and cannot coordinate with one another; the authors also advocate predictive autoscaling over reactive scaling that kicks in only after load has already spiked.
From there, the post evaluates Aperture, an open-source reliability management platform from FluxNinja designed around global visibility and closed-loop control. Aperture collects telemetry from service nodes into Prometheus, uses a standalone controller to monitor deviations from SLOs based on declarative YAML policies, and actuates proportional responses—such as load shedding or distributed rate limiting—at individual nodes. After integrating Aperture into a core service in their staging environment, DoorDash found it worked well as an easy-to-configure load shedder compared to their existing setup, though more advanced capabilities like coordinated multi-service failure mitigation remained to be tested.
Zero Configuration Service Mesh with On-Demand Cluster Discovery
The Netflix engineering team recounts their journey migrating to a service mesh. Netflix began moving to the cloud in 2008, with the streaming platform running entirely on AWS by 2010. Back when cloud-native tooling barely existed, they built Eureka for service discovery and Ribbon for inter-process communication (IPC). That architecture served them well for a decade, but as internal traffic diversified across REST, GraphQL, and gRPC in multiple programming languages—and teams needed advanced capabilities like adaptive concurrency limits and circuit breaking—maintaining polyglot client libraries became unsustainable. Moving to an Envoy-based service mesh let them centralize IPC logic in an out-of-process proxy.
The biggest roadblock was that Envoy expects every upstream cluster a service might call to be declared ahead of time, whereas a typical Netflix service talks to dozens of upstream clusters whose owners often don’t know the full dependency list—and pushing every cluster in the company to every Envoy proxy was impossible with millions of endpoints. Netflix partnered with Kinvolk and the Envoy community to build On-Demand Cluster Discovery: when an outgoing request targets an unknown cluster, Envoy pauses the request, queries the control plane via CDS (Cluster Discovery Service), fetches its endpoints via EDS backed by Eureka, and resumes the request. This made migration completely zero-configuration for service owners, at the cost of a few extra milliseconds on the very first request to a new cluster—meaning only ultra-latency-sensitive services need to pre-declare clusters or pre-warm connections.
The Quest to Understand Metric Movements
The Pinterest engineering team introduces the three pillars behind their automated Root Cause Analysis (RCA) system for investigating sudden spikes or drops in core business metrics—movements that can stem from anything from an OS upgrade to a broken data pipeline. The first approach, Slice and Dice, breaks a metric down across dimensions like country, device type, and Pin format into a hierarchical segment tree (inspired by LinkedIn’s ThirdEye) and scores each segment’s anomaly contribution; this proved especially effective for video playback metrics. The second approach, General Similarity, searches for other metrics that moved in a similar pattern over the same time window using Pearson correlation, Spearman rank correlation, Euclidean distance, and dynamic time warping—with Pearson and Spearman proving most useful because they provide p-values and capture inverse relationships cleanly (with the standard caveat that correlation does not imply causation).
The third approach, Experiment Effects, inverts traditional A/B test analysis: given a moving metric, it ranks active experiments that had the strongest statistically significant impact on that metric using Welch’s t-test and noise filters, and is now integrated into Pinterest’s experimentation platform covering nearly 2,000 metrics. Analysts can chain all three techniques iteratively to narrow down root causes. Looking ahead, Pinterest plans to incorporate user feedback loops, explore causal discovery to map cause-and-effect graphs across metrics, and embed RCA directly into their data discovery and visualization tools.
Meta’s Hyperscale Infrastructure: Overview and Insights
Chunqiang Tang provides a sweeping overview of Meta’s hyperscale infrastructure and the lessons learned along the way, arguing that while few engineers directly build infrastructure at this scale, many mainstream industry technologies originate there. Meta’s engineering culture revolves around four pillars: moving fast with continuous deployment, technological openness via a unified monorepo and major open-source projects like PyTorch, Llama, and Presto, conducting systems research directly on production infrastructure rather than in an isolated research lab, and standardizing on shared infrastructure building blocks (for instance, converging product teams onto ZippyDB as a common key-value store). To maximize developer productivity, Meta pushes continuous deployment to extreme scale—executing over 100,000 configuration changes per day with 97% of services deploying completely automatically, while roughly 50% more engineers write serverless functions than traditional long-running services.
To drive down hardware costs, Meta treats its global fleet of data centers as a single planet-scale computer, automatically placing and migrating workloads across regions, co-designing hardware and software to compensate for commodity hardware failure rates, and tiering storage across hot, warm, and cold media. On the AI front, Meta co-designs the entire stack—from PyTorch, custom AI accelerators, and datacenter fabrics up to foundation models like Llama—and projects that before the end of the decade, more than half of its datacenter power capacity will be dedicated to AI workloads.
Incremental Platforms: Monolithic Modular Architecture
Kicking off a series on incremental architecture for SaaS products, Marcos F. Lobo introduces the Modular Monolith: packaging and deploying the entire application as a single artifact while structuring the internal codebase into well-defined modules with clear responsibilities that communicate strictly through explicit interfaces and contracts. This approach retains the operational simplicity of a monolith while capturing the modularity benefits of decoupled design. To pull it off, the author advises defining strict module boundaries and using patterns like Facade to hide internal implementation details, enforcing high cohesion and low coupling within each module, aligning package structure with module boundaries so modules can be extracted later if needed, pairing use-case testing with CI/CD, and wiring dependencies via dependency injection or in-process messaging and events.
The benefits include simple single-artifact deployment and operations, easier refactoring and local development, fast in-memory calls between modules instead of network RPCs, straightforward transactional consistency, and natural alignment with Domain-Driven Design when modules map to bounded contexts. According to the author, a modular monolith is an ideal starting point for early-stage products, small teams, and systems that prioritize strong consistency, while serving as a clean stepping stone toward microservices if and when business scale demands it.
Bonus: Interesting videos from ByteByteGo
How the Garbage Collector Works in Java, Python, and Go!
Bonus 2: Interesting images from ByteByteGo
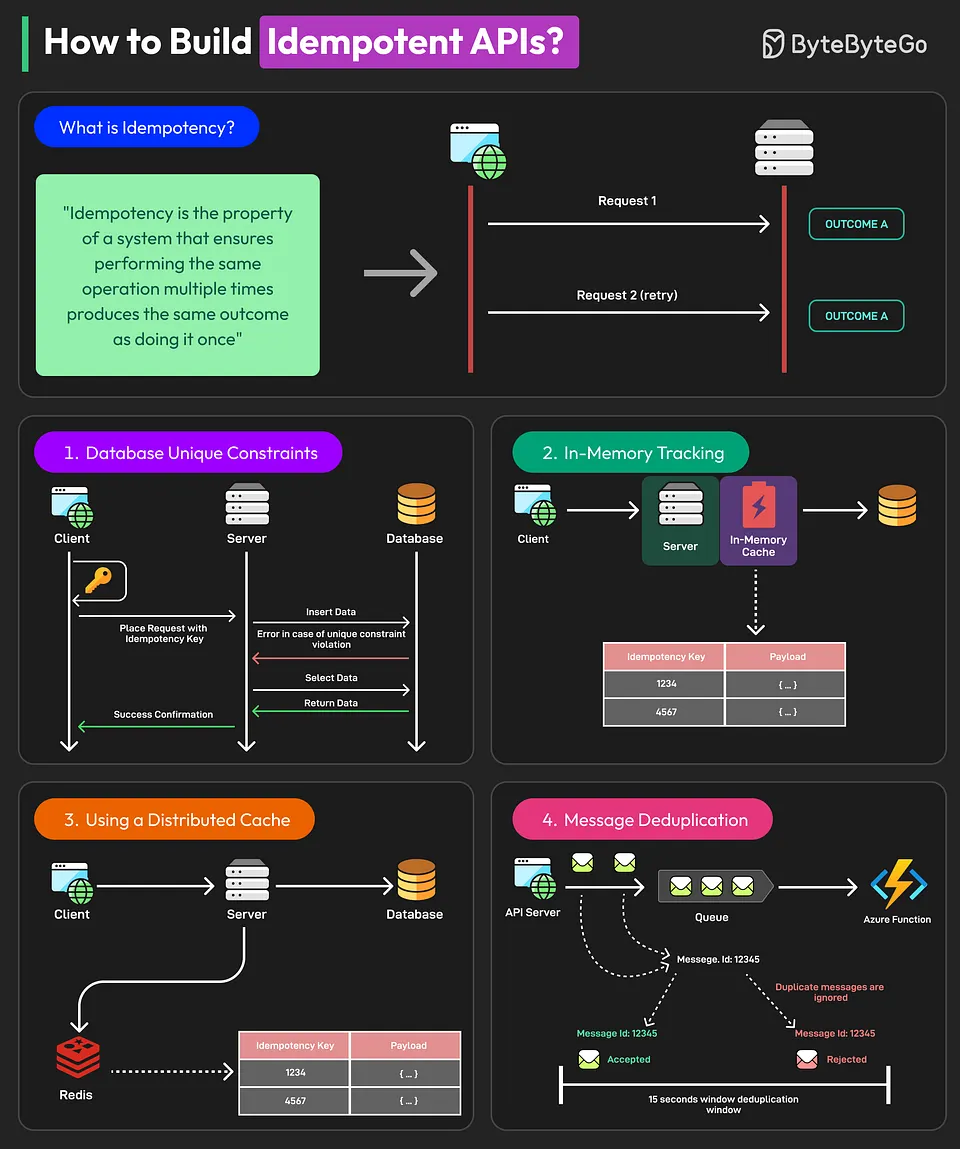
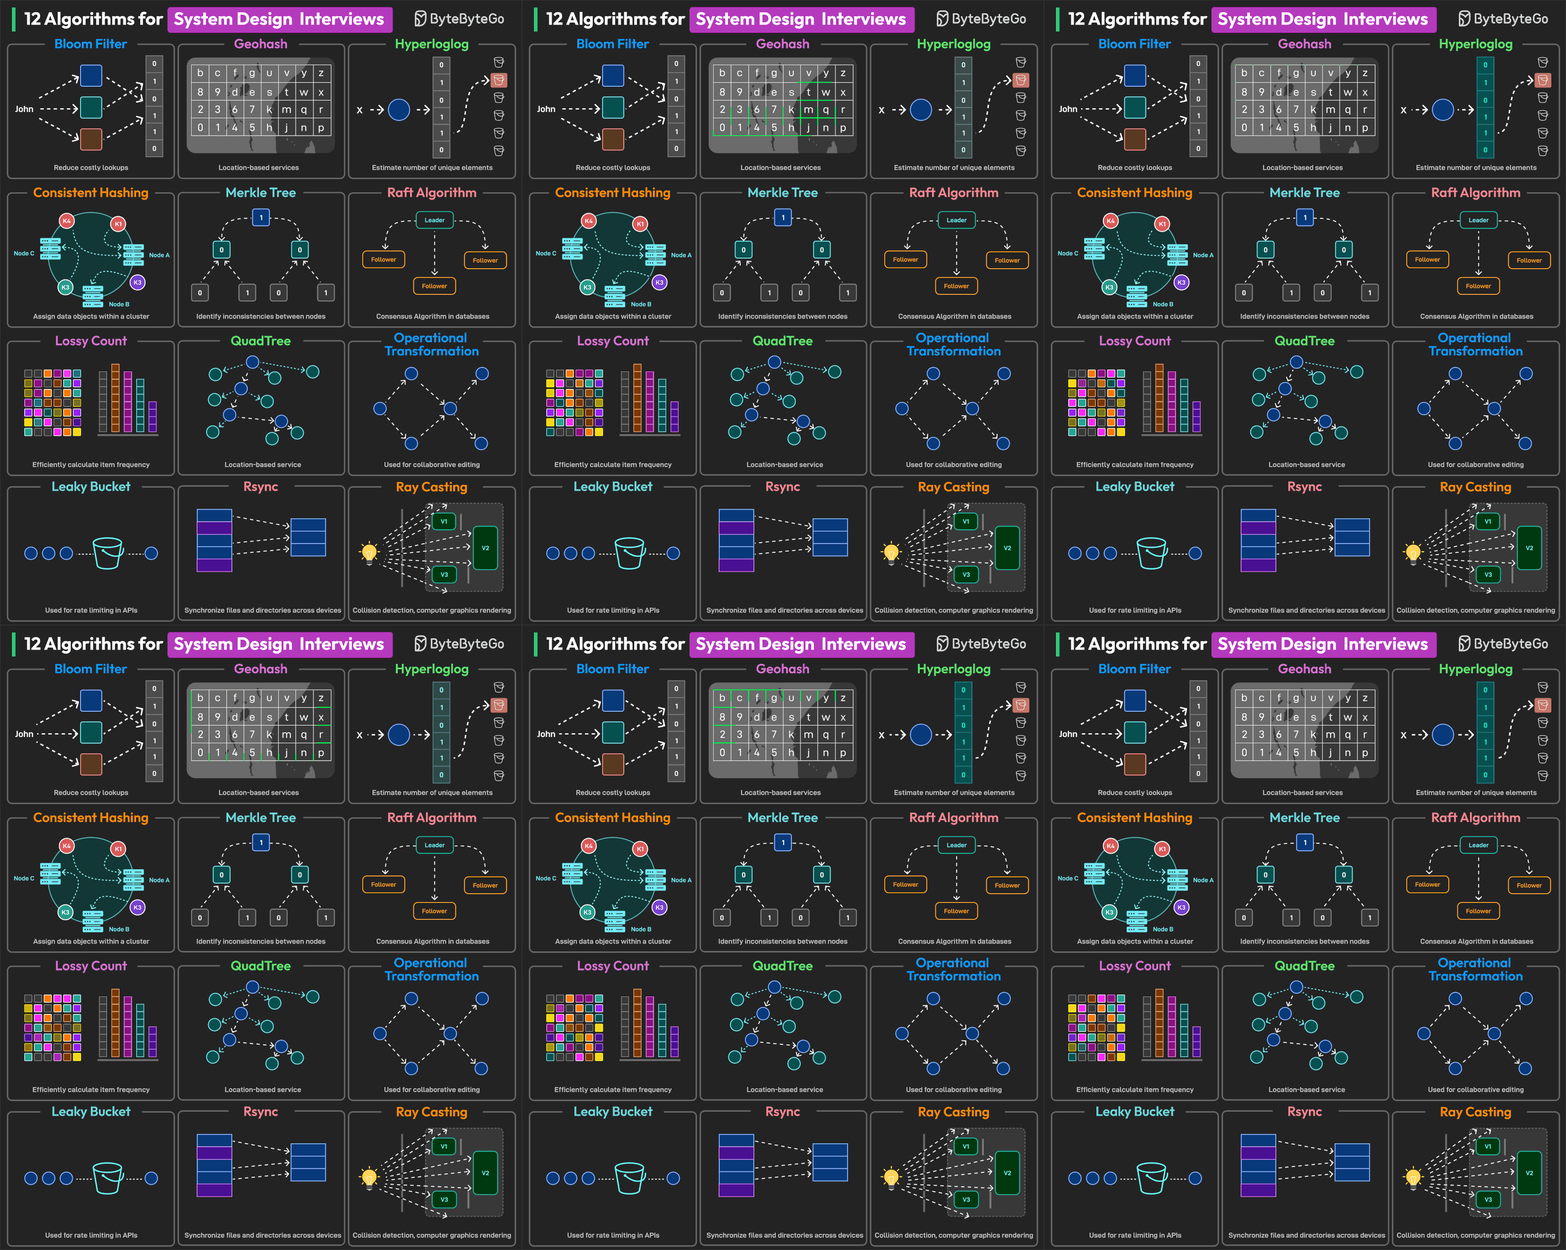
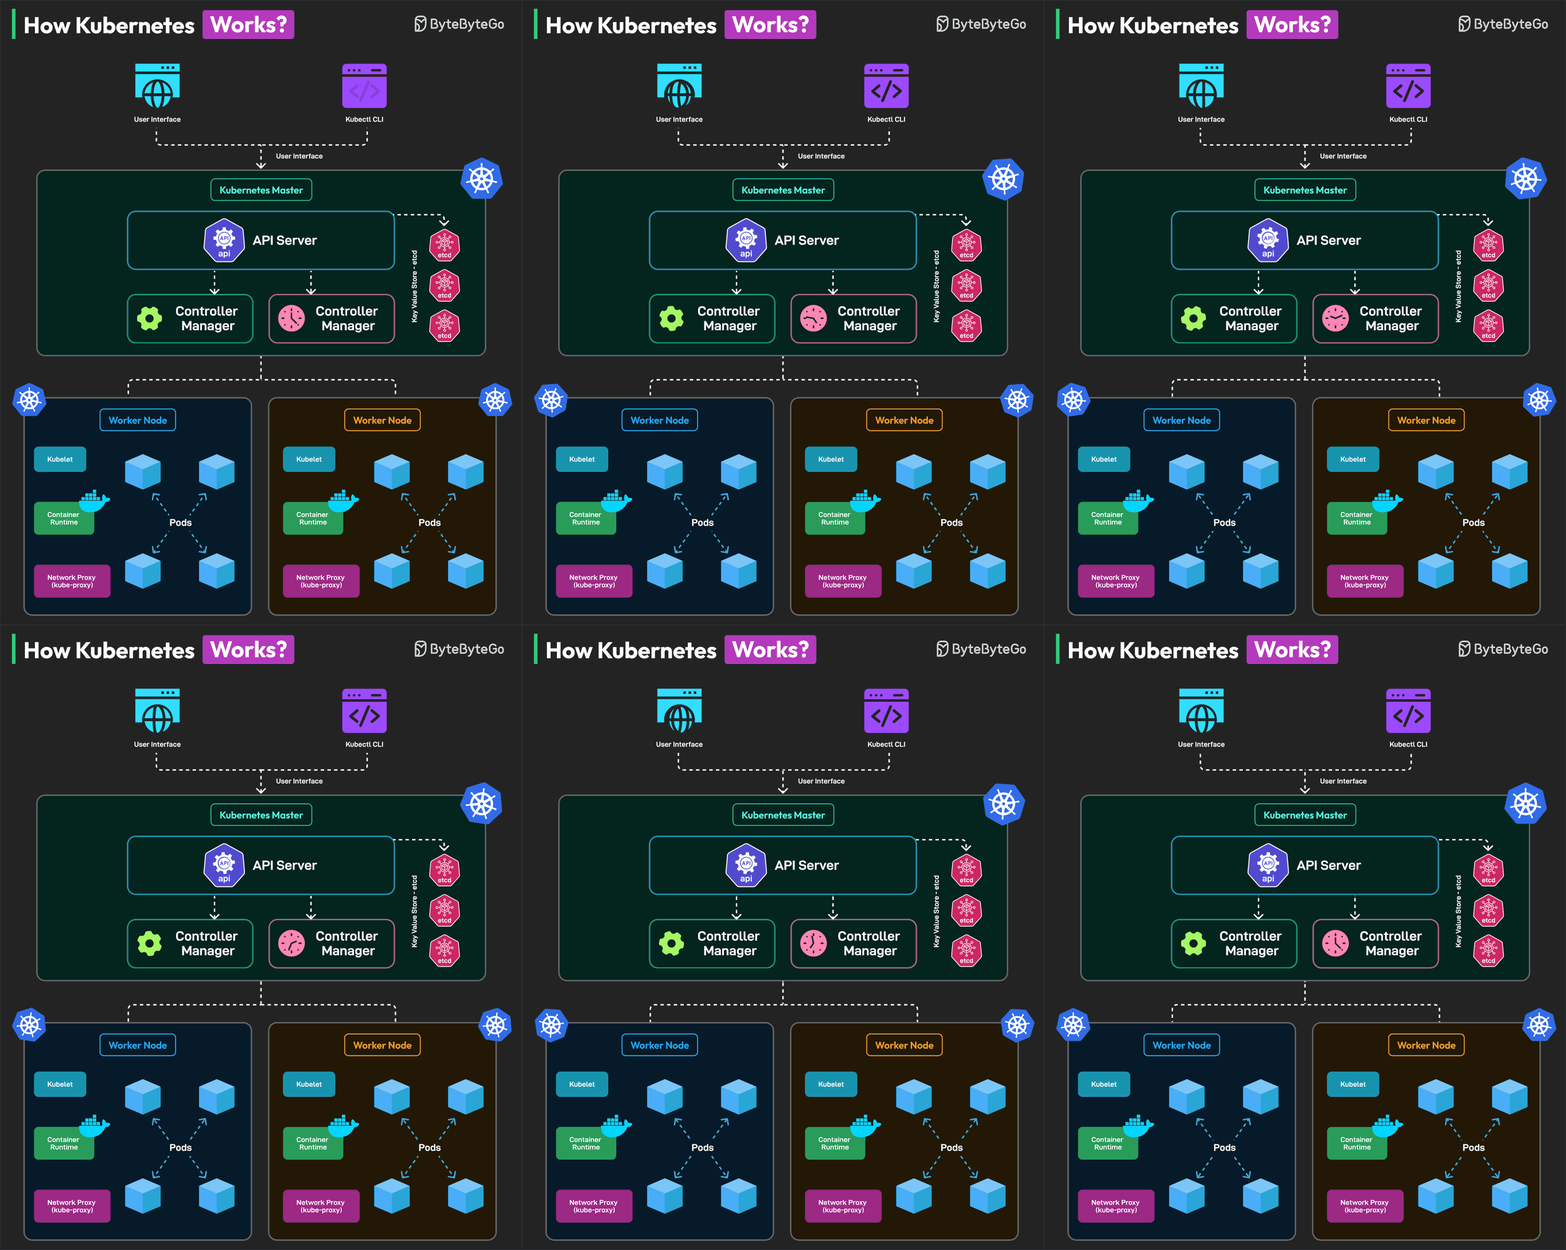
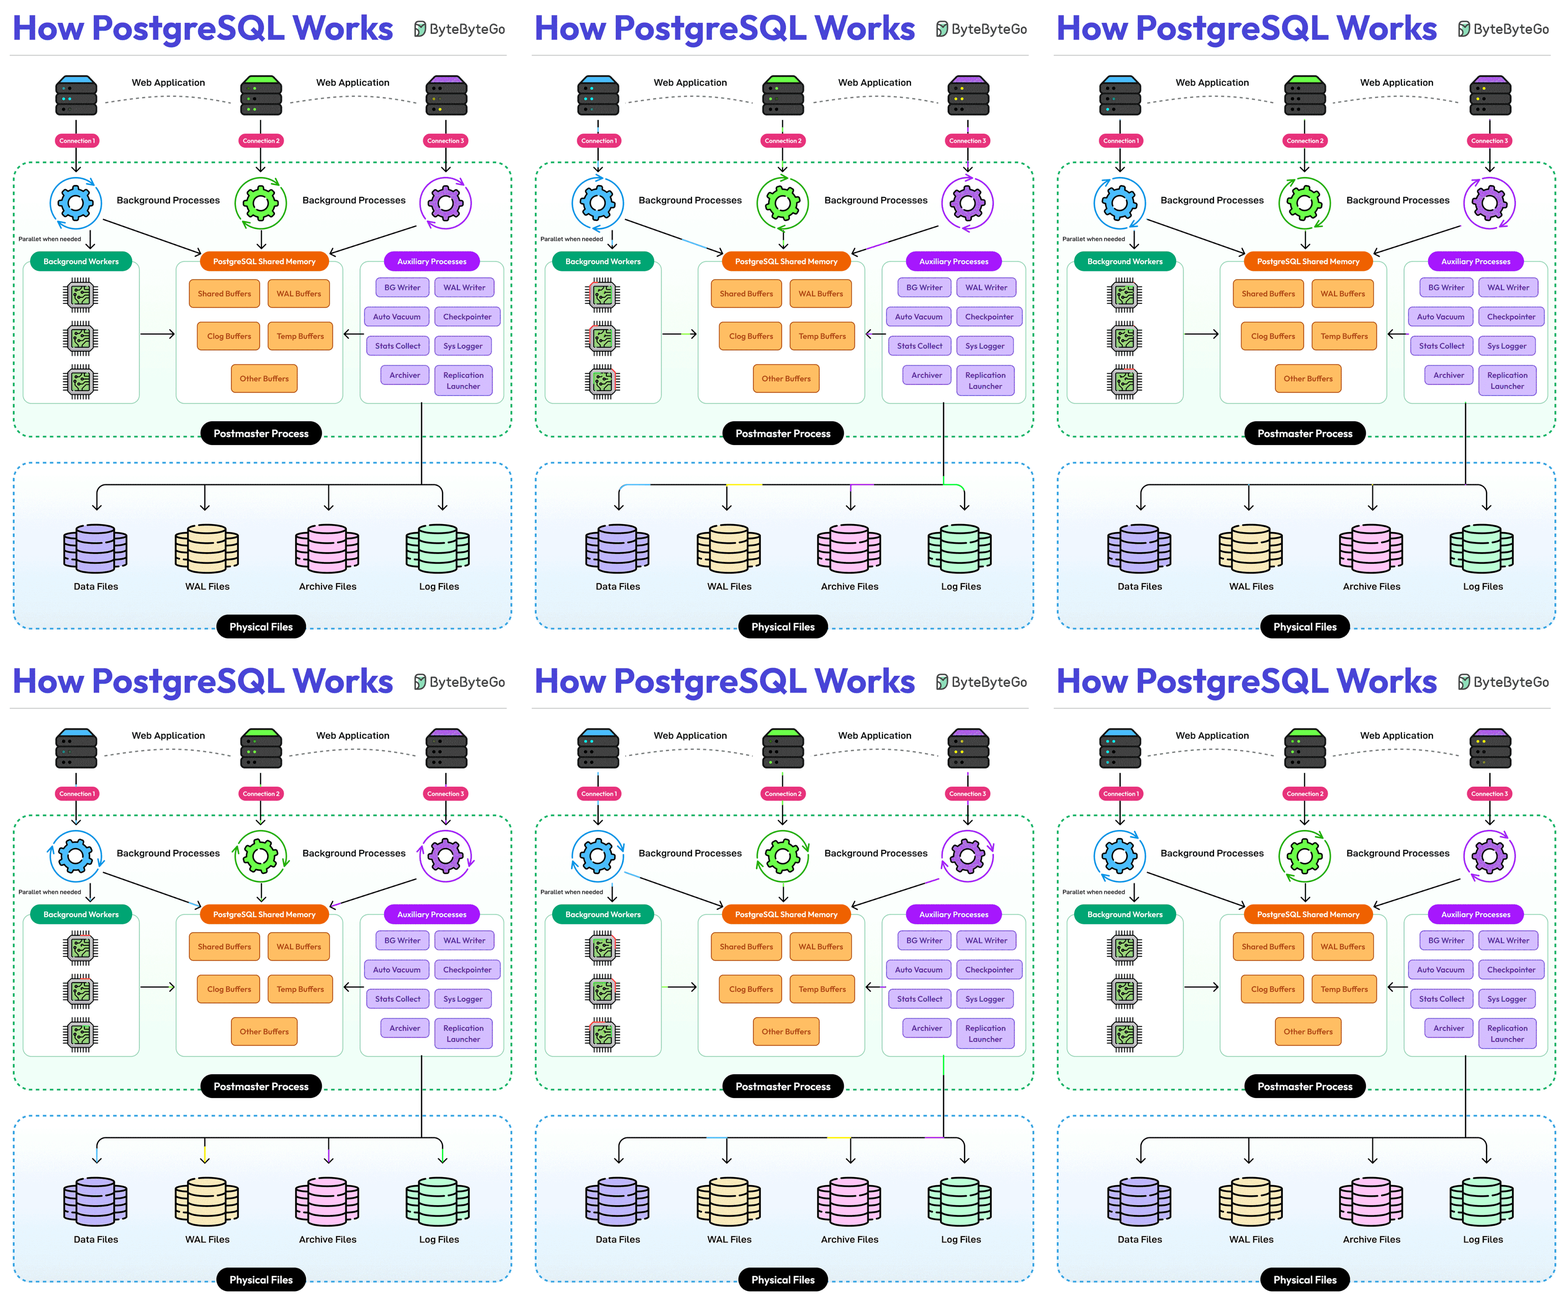
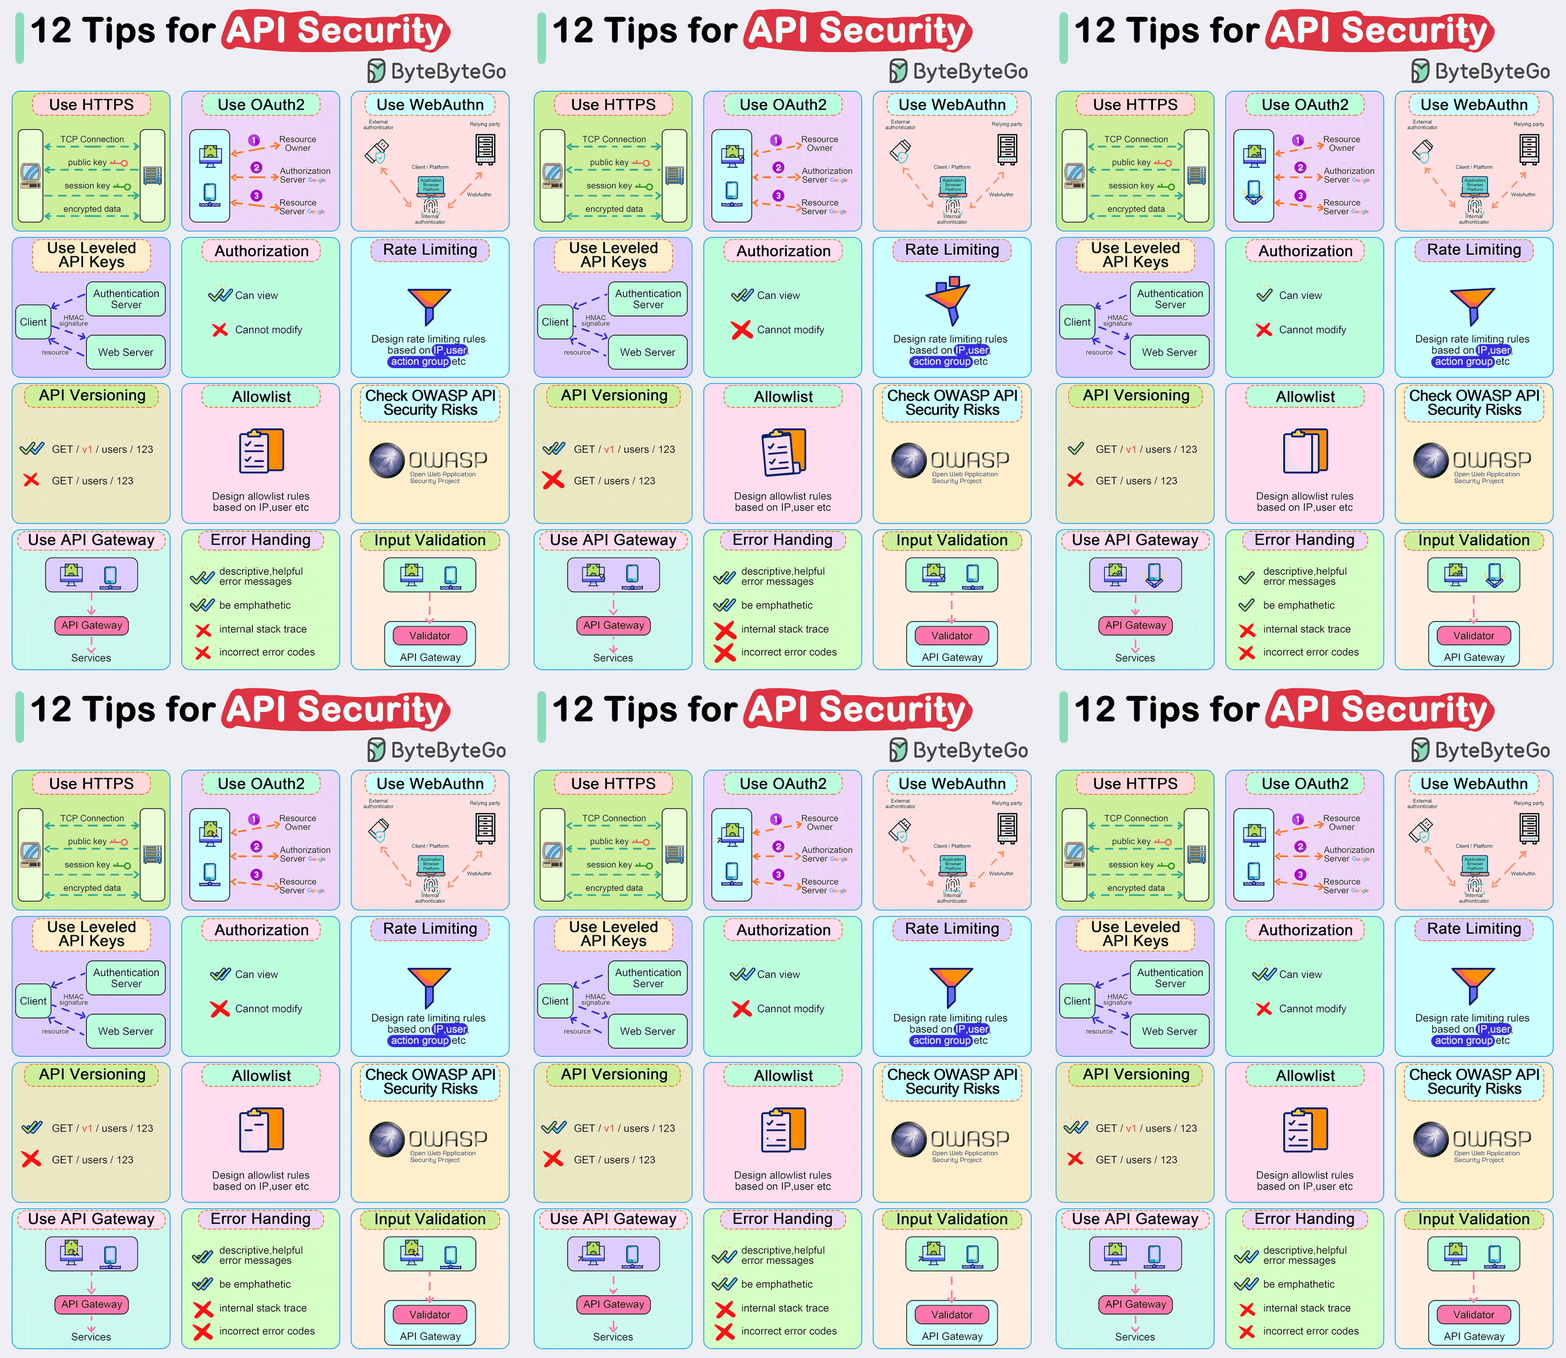
Bonus 3: Interesting images from DesignGurus
This post was rewritten by Claude Code with Opus 5.5 on 27/09/2026; reviewed and edited by Codex with GPT 6.1 Sol on 09/11/2026, and re-verified by Claude Code with Sonnet 5.5 on 16/11/2026.
Comments